
Overtime & Headcount Dashboard | Sustainability Dashboard
I leverage data aggregation and visualization tools to turn raw operational data into clear, actionable insights that drive decision-making across the business.
Using Excel and Power BI, I built dynamic dashboards that consolidate data from multiple sources, allowing leadership to monitor key metrics such as headcount, overtime, and sustainability performance in real time. For workforce management, I track trends in headcount alongside total hours and overtime, identifying inefficiencies, workload imbalances, and opportunities to optimize staffing. The dashboard highlights patterns by department and over time, enabling data-driven decisions to reduce unnecessary overtime and improve resource allocation.
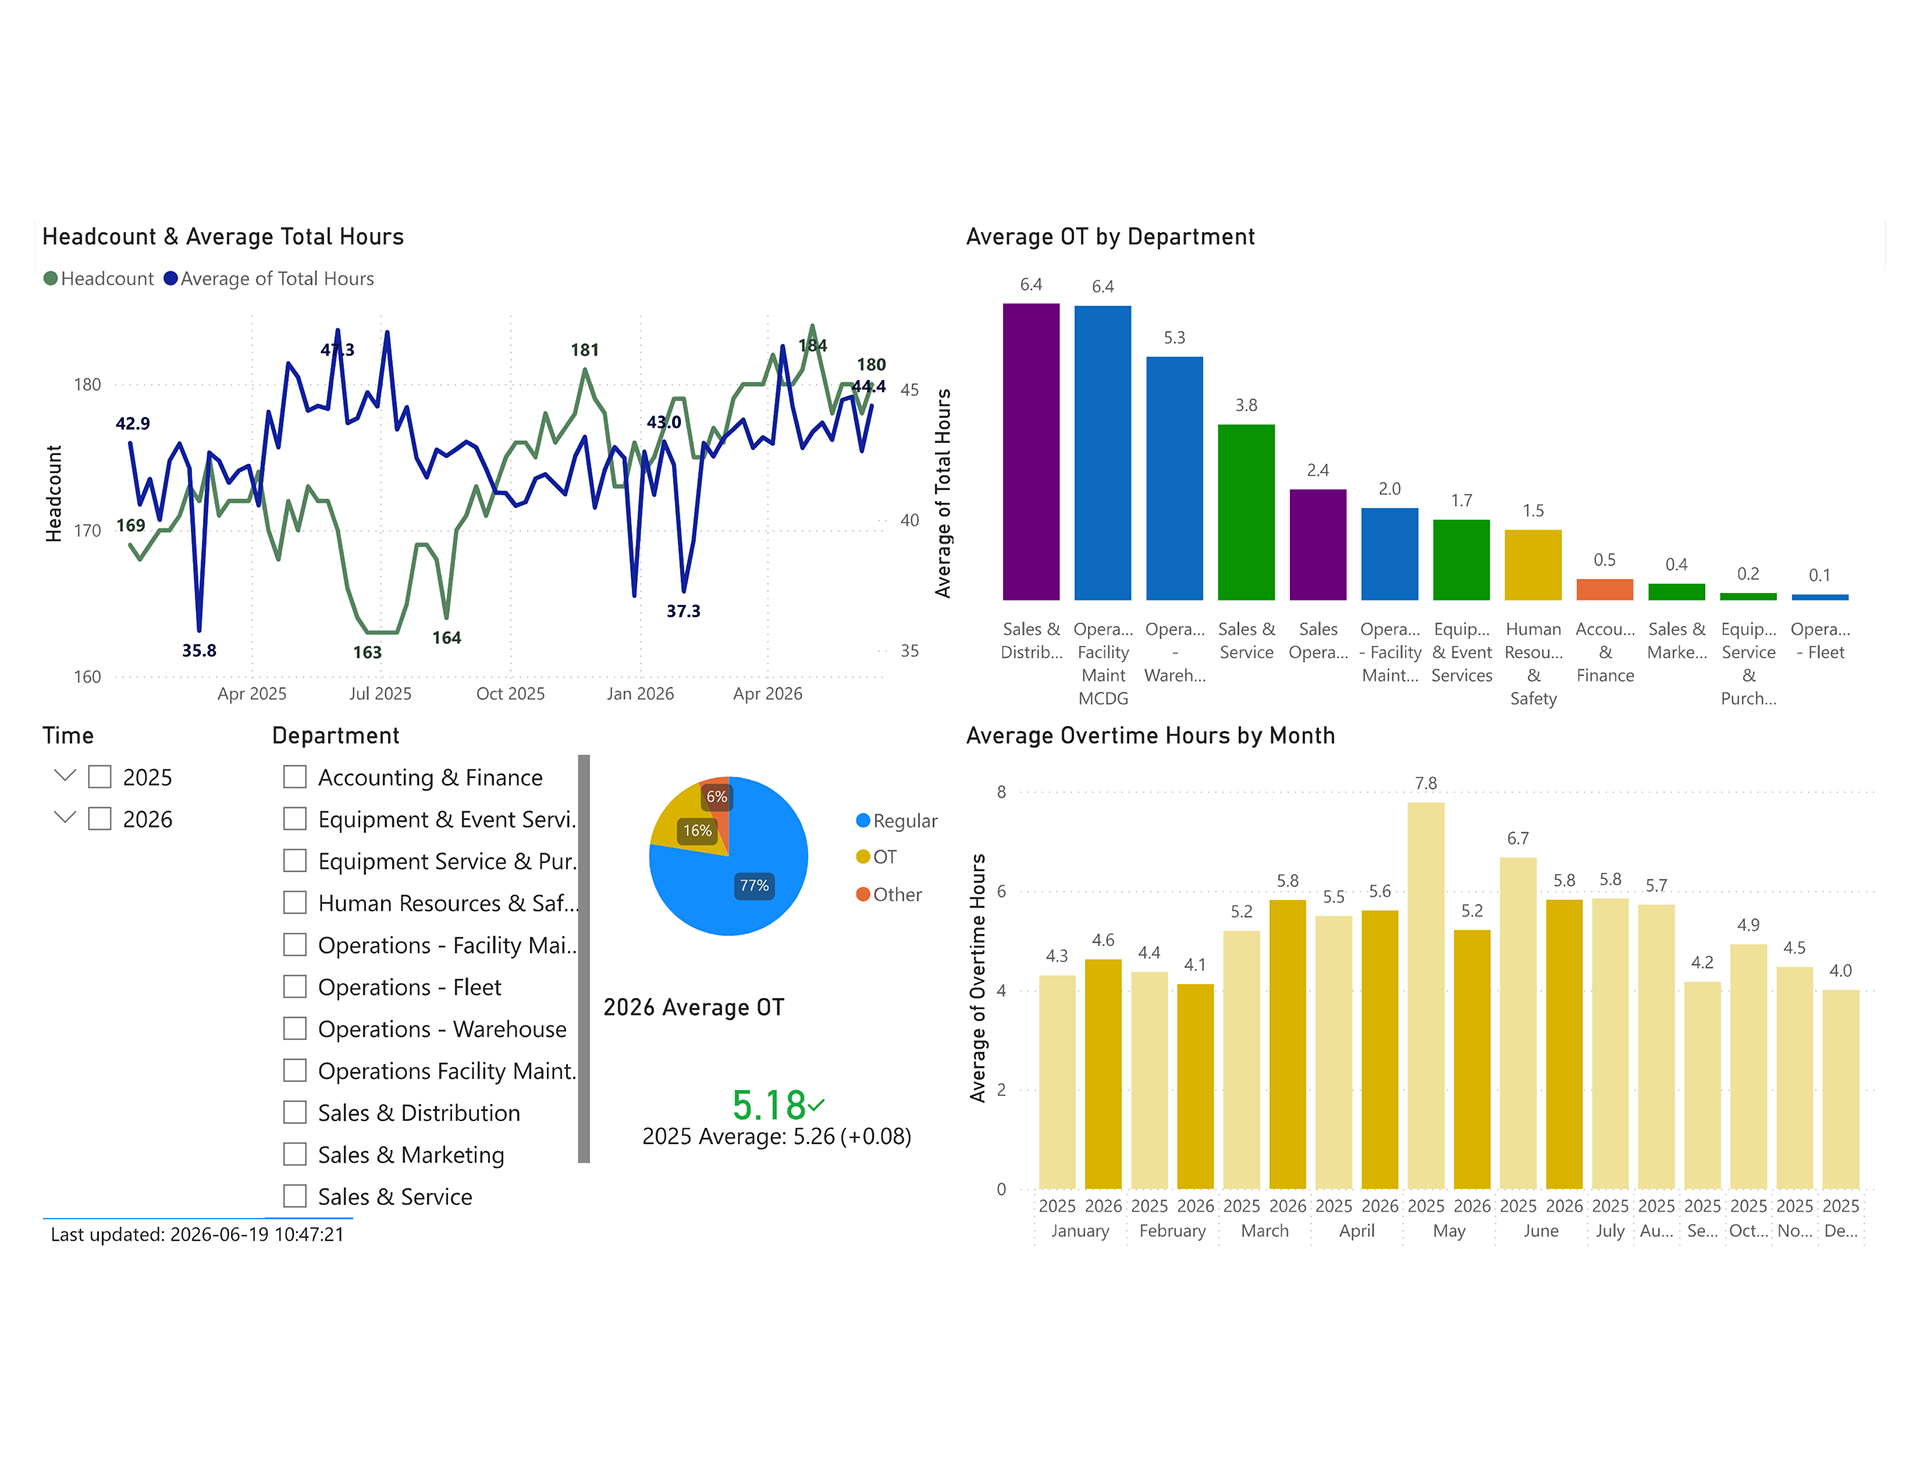
Headcount & Overtime Reporting
In parallel, I developed a sustainability reporting dashboard to support the company’s transition to zero waste to landfill. This dashboard aggregates environmental data such as material recovery, waste diversion, and greenhouse gas emissions. It visualizes total GHG reduction, net emissions, and material-specific impact, while also tracking efficiency rates across different waste streams.
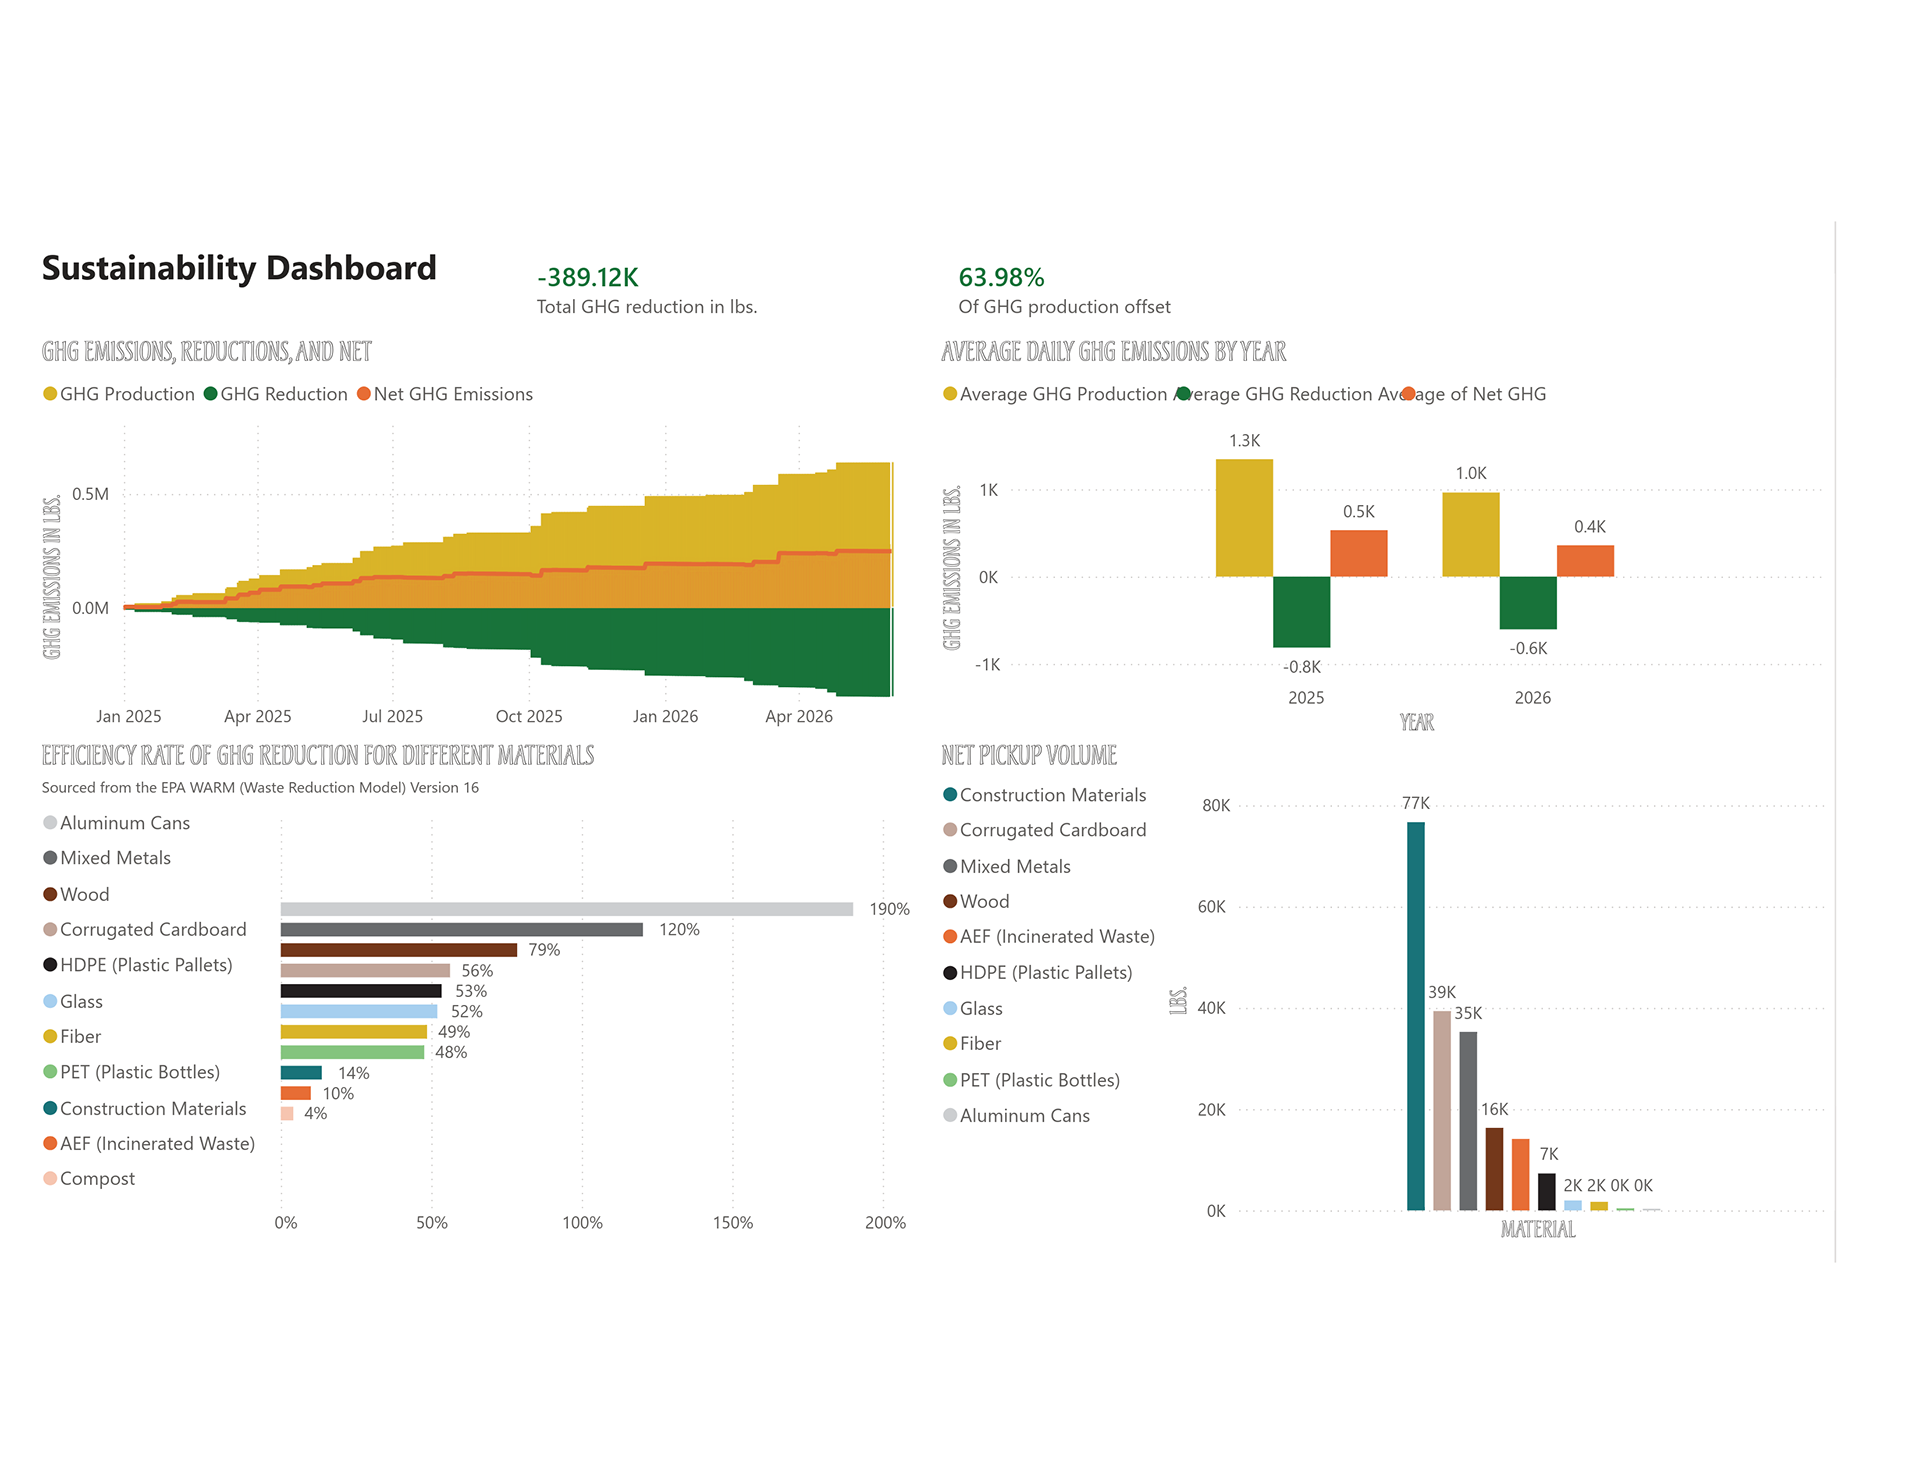
Sustainability Reporting
By combining these datasets with interactive visuals and automated updates, I provide stakeholders with a clear view of both operational efficiency and environmental impact. These tools not only improve transparency but also help guide strategic initiatives, from reducing overtime costs to advancing sustainability goals.